
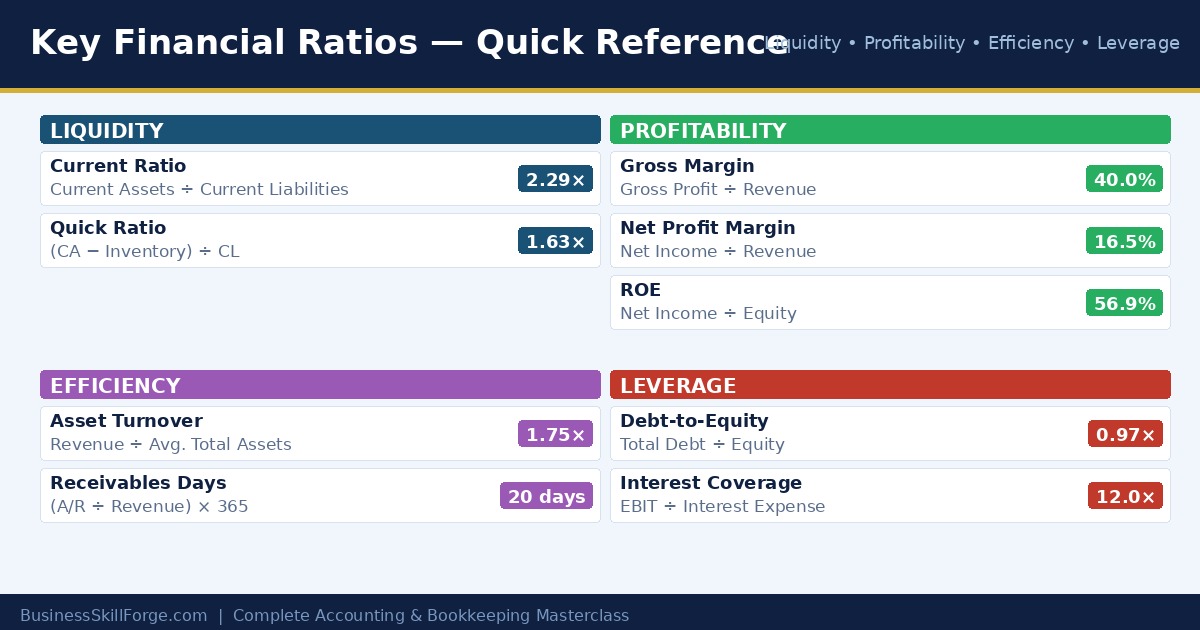
Why Financial Ratios Matter
A financial statement full of numbers doesn’t tell you much on its own. Is $500,000 in revenue good or bad? It depends. Financial ratios convert raw numbers into meaningful comparisons — letting you benchmark against competitors, track progress over time, and spot warning signs before they become crises.
Ratios are used by business owners, investors, lenders, and managers to answer questions like: “Can this company pay its bills?” or “Is it generating a good return?”
We organize ratios into four families:
1. Liquidity Ratios — Can the Business Pay Its Short-Term Bills?
Liquidity ratios measure a company’s ability to meet obligations due within the next 12 months.
Current Ratio
Formula: Current Assets ÷ Current Liabilities
A current ratio above 1.0 means the company has more short-term assets than short-term debts. A ratio of 2.0 is generally considered healthy — it means for every $1 owed in the next year, the company has $2 available to pay it.
Example: Current Assets = $110,000 | Current Liabilities = $48,000
Current Ratio = $110,000 ÷ $48,000 = 2.29× ✓ Healthy
Quick Ratio (Acid-Test Ratio)
Formula: (Current Assets − Inventory) ÷ Current Liabilities
This is a stricter test. It excludes inventory because inventory can’t always be sold quickly. A quick ratio above 1.0 is generally comfortable.
Example: ($110,000 − $32,000) ÷ $48,000 = 1.63× ✓ Strong
2. Profitability Ratios — How Well Is the Business Making Money?
Gross Profit Margin
Formula: (Gross Profit ÷ Revenue) × 100
Shows what percentage of sales revenue is kept after paying the direct cost of goods sold. Higher is better. A 40% gross margin means for every $1 of sales, $0.40 is left to cover operating costs and profit.
Example: Gross Profit = $200,000 | Revenue = $500,000
Gross Margin = ($200,000 ÷ $500,000) × 100 = 40%
Net Profit Margin
Formula: (Net Income ÷ Revenue) × 100
The bottom line — what percentage of revenue becomes actual profit after ALL expenses, interest, and taxes.
Example: Net Income = $82,500 | Revenue = $500,000
Net Margin = ($82,500 ÷ $500,000) × 100 = 16.5%
Return on Equity (ROE)
Formula: (Net Income ÷ Shareholders’ Equity) × 100
Tells investors how efficiently the company is using their money to generate profit. A 15–20% ROE is typically considered good in most industries.
Return on Assets (ROA)
Formula: (Net Income ÷ Total Assets) × 100
Measures how efficiently the company uses all its assets to generate profit, regardless of how those assets were financed.
3. Efficiency Ratios — How Well Is the Business Using Its Resources?
Asset Turnover Ratio
Formula: Revenue ÷ Average Total Assets
Shows how many dollars of revenue are generated for each dollar of assets. A ratio of 1.75× means the company generates $1.75 in sales for every $1 of assets it holds.
Accounts Receivable Days (Debtor Days)
Formula: (Accounts Receivable ÷ Revenue) × 365
How many days on average it takes customers to pay. Lower is better — it means the company is collecting cash quickly. A figure of 20 days is excellent; over 60 days is a warning sign.
Inventory Turnover
Formula: Cost of Goods Sold ÷ Average Inventory
How many times the company sells through its entire inventory in a year. High turnover means strong sales and lean inventory management.
4. Leverage Ratios — How Much Debt Is the Business Carrying?
Debt-to-Equity Ratio
Formula: Total Debt ÷ Shareholders’ Equity
Compares how much the company is financed by debt versus owner investment. A ratio below 1.0 generally indicates conservative, manageable debt. Above 2.0 can signal high financial risk.
Interest Coverage Ratio
Formula: EBIT ÷ Interest Expense
Can the company comfortably pay its interest expense from operating profits? A ratio of 3× or above is generally considered safe. Below 1.5× raises serious concerns about solvency.
Example: EBIT = $120,000 | Interest = $10,000
Coverage = $120,000 ÷ $10,000 = 12.0× ✓ Very safe
Using Ratios Effectively
Ratios are only meaningful when used in context. Always:
- Compare over time — Is the current ratio improving or deteriorating year over year?
- Compare to industry benchmarks — A 5% net margin is terrible for a software company but excellent for a grocery store
- Use multiple ratios together — No single ratio tells the whole story; strong liquidity combined with weak profitability suggests a different problem than the reverse
Quick Reference Summary
| Ratio | Formula | Healthy Range |
|---|---|---|
| Current Ratio | Current Assets ÷ Current Liabilities | 1.5× – 3.0× |
| Quick Ratio | (CA − Inventory) ÷ CL | > 1.0× |
| Gross Margin | Gross Profit ÷ Revenue | Varies by industry |
| Net Margin | Net Income ÷ Revenue | > 10% is good |
| ROE | Net Income ÷ Equity | 15%–25% |
| Debt-to-Equity | Total Debt ÷ Equity | < 1.0 preferred |
| Interest Coverage | EBIT ÷ Interest | > 3.0× |
Key Takeaways
- Financial ratios convert raw numbers into comparable, actionable insights
- The four ratio families are: Liquidity, Profitability, Efficiency, and Leverage
- Always compare ratios to prior periods and industry benchmarks — never in isolation
- Strong liquidity + strong profitability = a financially healthy business
- High debt ratios with low interest coverage = a warning sign worth investigating
Financial Ratios Practice Worksheet — Download, print, and complete to reinforce this lesson.