
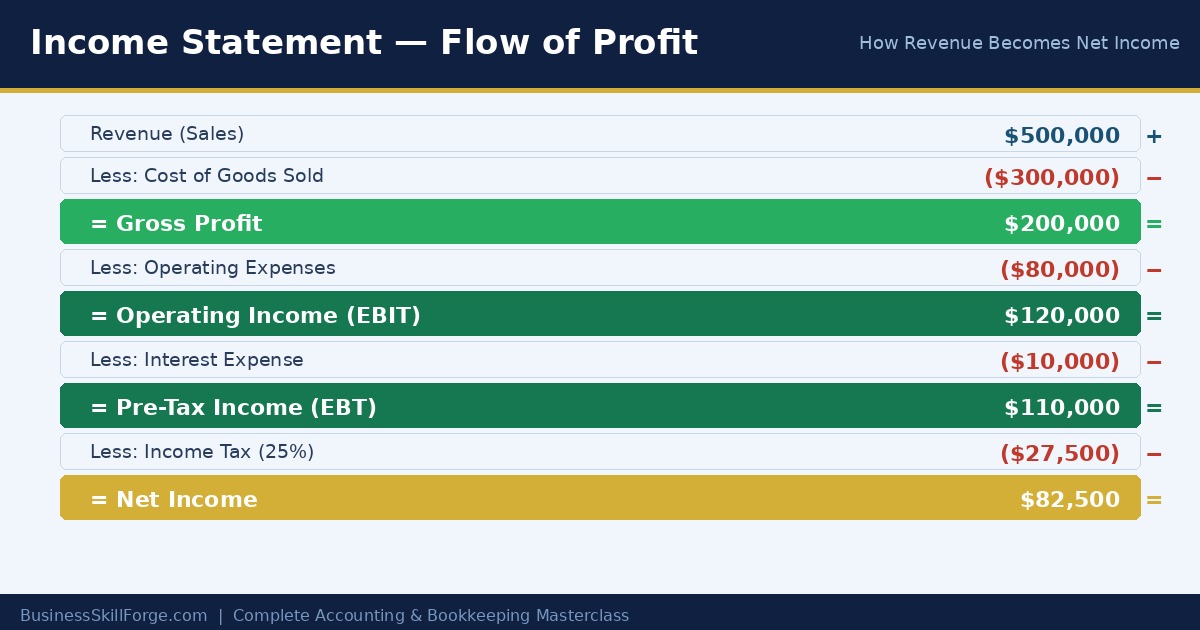
The Income Statement: Measuring Profit Over a Period
The income statement (also called the Profit and Loss Statement or P&L) reports a business’s financial performance over a specific time period — typically a month, quarter, or year. It answers one fundamental question: Did the business earn more than it spent?
Structure of the Income Statement
- Revenue (Sales / Turnover) — Total income from selling goods or services.
- Less: Cost of Goods Sold (COGS) — Direct costs of producing the goods/services sold.
- = Gross Profit — Revenue minus COGS. Measures the core business profitability before overheads.
- Less: Operating Expenses — Indirect costs: salaries, rent, marketing, depreciation, utilities.
- = Operating Profit (EBIT) — Earnings Before Interest and Tax. Measures profit from core operations.
- Less/Plus: Finance Costs / Income — Interest on borrowings; interest earned on investments.
- = Profit Before Tax (PBT)
- Less: Income Tax Expense
- = Net Profit (Net Income) — The “bottom line.” What remains for the owners.
Sample Income Statement
TechFlow Solutions — Income Statement for the Year Ended 31 March 2025
Revenue: $5,000,000
Less COGS: ($2,000,000)
Gross Profit: $3,000,000 (Gross Margin: 60%)
Less Operating Expenses: ($1,800,000)
Operating Profit (EBIT): $1,200,000
Less Interest Expense: ($200,000)
PBT: $1,000,000
Less Tax (25%): ($250,000)
Net Profit: $750,000
Key Profit Margins to Monitor
- Gross Margin = Gross Profit ÷ Revenue × 100. Higher is better — indicates how much is left after direct costs.
- Operating Margin = EBIT ÷ Revenue × 100. Measures operational efficiency.
- Net Profit Margin = Net Profit ÷ Revenue × 100. The ultimate profitability measure.
Single-Step vs. Multi-Step Income Statement
A single-step statement lists all revenues, then all expenses, and subtracts. Simple but less informative.
A multi-step statement (shown above) separates gross profit from operating profit from net profit. It gives far more analytical insight and is preferred for management and investor use.
EBITDA: A Popular Proxy for Cash Flow
EBITDA (Earnings Before Interest, Tax, Depreciation and Amortisation) adds back non-cash charges to operating profit. It is widely used in business valuation and for comparing companies across different capital structures. However, it is not a substitute for actual cash flow analysis.
Lesson Summary
- Income statement: Revenue → Gross Profit → EBIT → PBT → Net Profit.
- Key margins: gross, operating, and net profit margin.
- Multi-step format provides more analytical depth than single-step.
Multi-Step vs. Single-Step Income Statement
There are two formats for the income statement:
- Single-step: All revenues together minus all expenses together = net income. Simple but lacks detail.
- Multi-step: Shows gross profit, operating income, and net income separately. Far more useful for analysis.
Most businesses, banks, and investors use the multi-step format. Here is a full multi-step income statement for Summit Outdoor Gear:
| Income Statement — Summit Outdoor Gear | Year Ended Dec 31 | Amount ($) |
|---|---|
| Revenue | |
| Net Sales Revenue | 480,000 |
| Cost of Goods Sold | |
| Beginning Inventory | 45,000 |
| + Purchases | 210,000 |
| − Ending Inventory | (38,000) |
| = Cost of Goods Sold | (217,000) |
| GROSS PROFIT | 263,000 |
| Operating Expenses | |
| Salaries & Wages | 85,000 |
| Rent | 24,000 |
| Depreciation | 12,000 |
| Marketing | 18,000 |
| Other Operating Expenses | 9,000 |
| Total Operating Expenses | (148,000) |
| OPERATING INCOME (EBIT) | 115,000 |
| Interest Expense | (8,000) |
| Income Before Tax (EBT) | 107,000 |
| Income Tax Expense (25%) | (26,750) |
| NET INCOME | $80,250 |
Key Profitability Ratios From the Income Statement
| Metric | Formula | Summit Result | What It Means |
|---|---|---|---|
| Gross Profit Margin | Gross Profit ÷ Revenue | $263,000 ÷ $480,000 = 54.8% | For every $1 of sales, $0.548 remains after production costs |
| Operating Margin | EBIT ÷ Revenue | $115,000 ÷ $480,000 = 24.0% | 24 cents of operating profit from each dollar sold |
| Net Profit Margin | Net Income ÷ Revenue | $80,250 ÷ $480,000 = 16.7% | After all costs including tax, 16.7 cents kept per dollar sold |
The income statement shows revenue when earned, not when cash arrives. A company can report $480,000 of revenue but have far less cash if clients haven’t paid yet. Always cross-reference the income statement with the cash flow statement.
Income Statement Practice Worksheet — Download, print, and complete to reinforce this lesson.