
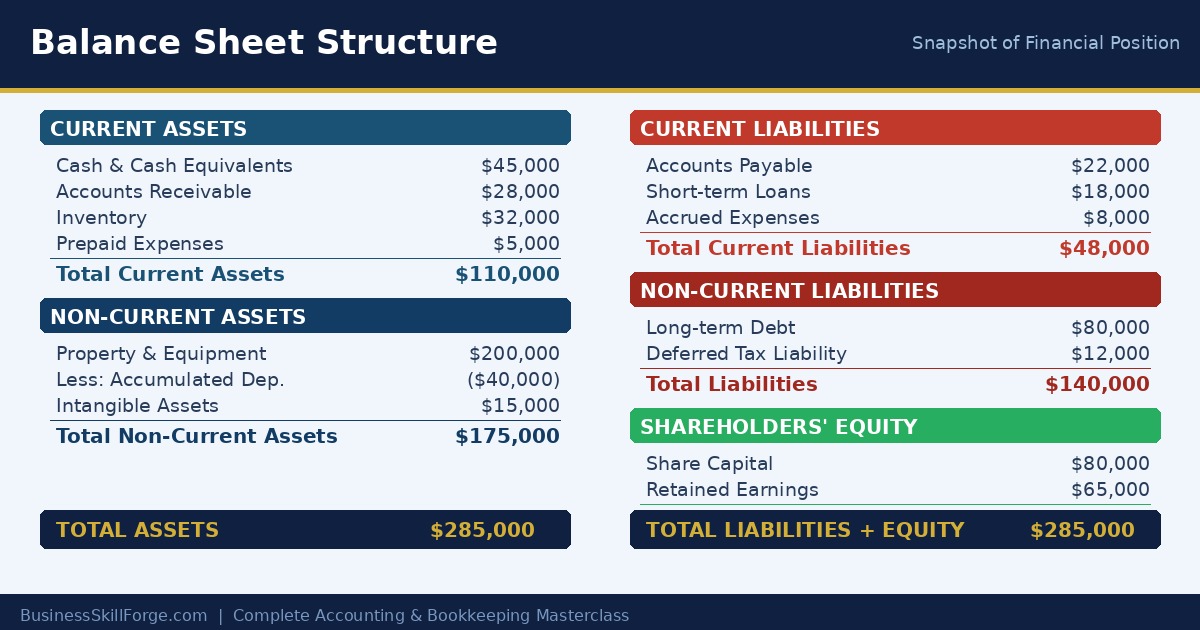
The Balance Sheet: A Snapshot of Financial Position
The balance sheet (also called the Statement of Financial Position) shows, at a specific date, everything a business owns (assets) and everything it owes (liabilities), with the difference being the owners’ equity. It always satisfies: Assets = Liabilities + Equity.
Structure of a Balance Sheet
Assets Section
Current Assets (expected to convert to cash within 12 months):
- Cash and cash equivalents
- Short-term investments
- Accounts receivable (net of bad debt allowance)
- Inventory
- Prepaid expenses
Non-Current Assets (held for more than 12 months):
- Property, plant and equipment (net of accumulated depreciation)
- Intangible assets (patents, trademarks, goodwill)
- Long-term investments
Liabilities Section
Current Liabilities (due within 12 months):
- Accounts payable
- Short-term borrowings
- Accrued liabilities (salaries payable, interest payable)
- Deferred revenue (current portion)
Non-Current Liabilities (due after 12 months):
- Long-term debt
- Deferred tax liabilities
- Pension obligations
Equity Section
- Share capital / Owner’s capital
- Retained earnings (accumulated net income minus dividends)
- Other comprehensive income (for listed companies)
Reading a Simple Balance Sheet
Bright Ideas Consulting — Balance Sheet as at 31 March 2025
ASSETS
Cash: $80,000 | Accounts Receivable: $120,000 | Equipment (net): $300,000
Total Assets: $500,000LIABILITIES
Accounts Payable: $60,000 | Bank Loan: $140,000
Total Liabilities: $200,000EQUITY
Owner’s Capital: $250,000 | Retained Earnings: $50,000
Total Equity: $300,000✓ $500,000 = $200,000 + $300,000
Key Things to Look for on Any Balance Sheet
- Current ratio (Current Assets ÷ Current Liabilities) — Can the business pay its short-term obligations?
- Debt-to-equity ratio — How much of the business is funded by debt vs. owners?
- Net asset value — Total Assets minus Total Liabilities = what owners actually own.
Lesson Summary
- The balance sheet is a point-in-time snapshot: Assets = Liabilities + Equity.
- Assets are classified as current or non-current; liabilities similarly.
- Key metrics derived: current ratio, debt-to-equity ratio, net asset value.
Balance Sheet Deep Dive: Assets, Liabilities, and Equity
The balance sheet is a snapshot — not a movie. It captures financial position at one moment, like a photograph. Understanding what belongs where is the foundation of financial analysis.
Current vs. Non-Current: The Key Distinction
| Category | Definition | Examples | Rule of Thumb |
|---|---|---|---|
| Current Assets | Converted to cash within 12 months | Cash, Accounts Receivable, Inventory, Prepaid Expenses | Listed in order of liquidity (cash first) |
| Non-Current Assets | Long-term, used over many years | Equipment, Buildings, Land, Intangibles, Goodwill | Shown net of accumulated depreciation |
| Current Liabilities | Due within 12 months | Accounts Payable, Accrued Expenses, Short-term Loans, Deferred Revenue | Pay with current assets |
| Non-Current Liabilities | Due beyond 12 months | Long-term bonds, Mortgage, Pension Obligations | Funded by long-term capital |
| Equity | Residual claim of owners | Common Stock, Retained Earnings, Additional Paid-In Capital | Always = Assets − Liabilities |
Full Balance Sheet Example: Meridian Software Inc. (Dec 31)
| ASSETS | $ | LIABILITIES & EQUITY | $ |
|---|---|---|---|
| Current Assets | Current Liabilities | ||
| Cash | 85,000 | Accounts Payable | 32,000 |
| Accounts Receivable | 48,000 | Accrued Wages | 8,500 |
| Inventory | 27,000 | Income Tax Payable | 6,000 |
| Prepaid Insurance | 4,000 | Short-term Bank Loan | 25,000 |
| Total Current Assets | 164,000 | Total Current Liabilities | 71,500 |
| Non-Current Assets | Non-Current Liabilities | ||
| Equipment | 120,000 | Long-term Loan | 80,000 |
| Less: Accum. Depreciation | (35,000) | ||
| Land | 50,000 | Total Non-Current Liabilities | 80,000 |
| Total Non-Current Assets | 135,000 | Equity | |
| Common Stock | 60,000 | ||
| Retained Earnings | 87,500 | ||
| Total Equity | 147,500 | ||
| TOTAL ASSETS | 299,000 | TOTAL L + E | 299,000 |
$299,000 = $299,000 ✓. Assets always equal Liabilities + Equity. If your balance sheet doesn’t balance, there’s an error — find it before presenting to investors or the bank.
Balance Sheet Practice Worksheet — Download, print, and complete to reinforce this lesson.