Section 3: The Core Financial Statements
5 lessons in this module. Work through each lesson top to bottom; download the templates and worksheets inside each lesson.
The Big Picture matters because it’s a core skill every US bookkeeper and accountant relies on to keep the books accurate and decision-ready. This lesson covers the mechanics, a clear worked example, and the common mistakes that trip up beginners.
Apply the concepts of the big picture to a real US-market scenario, using the downloadable template attached.
Financial Statements: The Three Reports That Tell a Business’s Story
Three core financial statements together give a complete, interconnected picture of a business’s financial health. No single statement tells the full story — you need all three.
The Three Statements at a Glance
| Statement | Question It Answers | Time Frame |
|---|---|---|
| Balance Sheet | What does the business own and owe right now? | A single point in time |
| Income Statement | Did the business make a profit this period? | Over a period (month/year) |
| Cash Flow Statement | How did cash actually move in and out? | Over a period (month/year) |
How the Three Statements Connect
Net income from the income statement flows into retained earnings on the balance sheet. The ending cash balance on the cash flow statement matches cash on the balance sheet. Changes in balance sheet accounts explain the cash flow statement line items. These connections mean an error in one statement often shows up in another — making the three-statement model a powerful self-checking system.
Who Reads Financial Statements?
- Investors — Assess profitability, growth trajectory, and return on investment.
- Lenders — Evaluate whether the business can repay loans (focus on liquidity and debt levels).
- Management — Track performance, identify inefficiencies, and make operational decisions.
- Tax authorities — Verify that income and expenses are correctly reported.
- Suppliers — Assess creditworthiness before extending payment terms.
The Notes to Financial Statements
The numbers alone don’t tell everything. The notes (also called footnotes or disclosures) explain accounting policies used, details of significant transactions, contingent liabilities, related-party transactions, and anything else a reader needs to interpret the figures correctly. Always read the notes — that’s where the important context lives.
Lesson Summary
- Three statements: balance sheet (position), income statement (performance), cash flow statement (liquidity).
- All three are interconnected — net income links income statement to balance sheet; cash links balance sheet to cash flow statement.
- Notes to financial statements provide the context needed to interpret the numbers.
The Four Financial Statements — A Complete Overview
| Statement | Answers the Question | Time Frame | Key Formula |
|---|---|---|---|
| Income Statement | Did we make a profit? | A period (month, quarter, year) | Revenue − Expenses = Net Income |
| Balance Sheet | What do we own and owe? | A point in time (snapshot) | Assets = Liabilities + Equity |
| Cash Flow Statement | Where did cash come from and go? | A period | Operating + Investing + Financing CF |
| Statement of Retained Earnings | How did equity change? | A period | Beg. RE + Net Income − Dividends = End. RE |
Why the Order of Preparation Matters
The statements must be prepared in sequence because each one feeds the next:
- Income Statement first — calculates Net Income.
- Statement of Retained Earnings second — uses Net Income to update RE.
- Balance Sheet third — uses ending RE from Step 2 to complete Equity section.
- Cash Flow Statement fourth — uses Net Income (indirect method) and balance sheet changes.
If you prepare the balance sheet before the income statement, you won’t know what to put in retained earnings. The sequence isn’t arbitrary — it’s logical dependency.
Snapshot: Riverview Landscaping, Year-End
| Statement | Key Figure | Riverview Result |
|---|---|---|
| Income Statement | Net Income | $42,000 |
| Statement of RE | Ending Retained Earnings | $88,000 → $88,000+$42,000−$10,000 div = $120,000 |
| Balance Sheet | Total Assets | $280,000 = $160,000 liabilities + $120,000 equity |
| Cash Flow Statement | Net Change in Cash | $22,000 (operating +$55,000, investing −$30,000, financing −$3,000) |
| Bank Statement | Ending Cash | $47,000 (agrees with balance sheet cash) |
Every number in financial statements traces back to journal entries, which trace back to source documents. This chain of evidence — from receipt to journal to ledger to financial statement — is what makes accounting auditable and trustworthy.
Financial Statements Practice Worksheet — Download, print, and complete to reinforce this lesson.
Multi-sheet workbook · pre-built formulas · plug in your own numbers · yours to keep.
Disclaimer. This lesson is educational. The worked example uses representative numbers and does not constitute personalized financial, tax, legal, or investment advice. Trading and investing involve risk including loss of principal. US tax rates change annually — verify against the current IRS publications and your specific state’s tax code. See our Financial Disclaimer for the full statement.
What Your Business Owns and Owes matters because it’s a core skill every US bookkeeper and accountant relies on to keep the books accurate and decision-ready. This lesson covers the mechanics, a clear worked example, and the common mistakes that trip up beginners.
Apply the concepts of what your business owns and owes to a real US-market scenario, using the downloadable template attached.
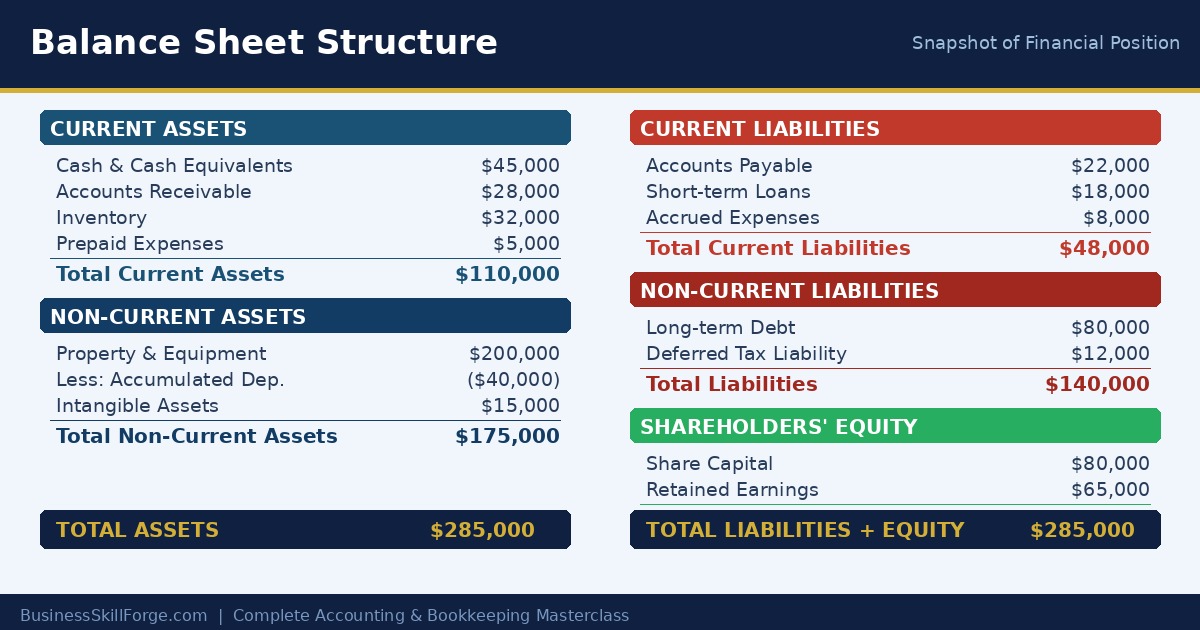
The Balance Sheet: A Snapshot of Financial Position
The balance sheet (also called the Statement of Financial Position) shows, at a specific date, everything a business owns (assets) and everything it owes (liabilities), with the difference being the owners’ equity. It always satisfies: Assets = Liabilities + Equity.
Structure of a Balance Sheet
Assets Section
Current Assets (expected to convert to cash within 12 months):
- Cash and cash equivalents
- Short-term investments
- Accounts receivable (net of bad debt allowance)
- Inventory
- Prepaid expenses
Non-Current Assets (held for more than 12 months):
- Property, plant and equipment (net of accumulated depreciation)
- Intangible assets (patents, trademarks, goodwill)
- Long-term investments
Liabilities Section
Current Liabilities (due within 12 months):
- Accounts payable
- Short-term borrowings
- Accrued liabilities (salaries payable, interest payable)
- Deferred revenue (current portion)
Non-Current Liabilities (due after 12 months):
- Long-term debt
- Deferred tax liabilities
- Pension obligations
Equity Section
- Share capital / Owner’s capital
- Retained earnings (accumulated net income minus dividends)
- Other comprehensive income (for listed companies)
Reading a Simple Balance Sheet
Bright Ideas Consulting — Balance Sheet as of December 31, 2025
ASSETS
Cash: $80,000 | Accounts Receivable: $120,000 | Equipment (net): $300,000
Total Assets: $500,000LIABILITIES
Accounts Payable: $60,000 | Bank Loan: $140,000
Total Liabilities: $200,000EQUITY
Owner’s Capital: $250,000 | Retained Earnings: $50,000
Total Equity: $300,000✓ $500,000 = $200,000 + $300,000
Key Things to Look for on Any Balance Sheet
- Current ratio (Current Assets ÷ Current Liabilities) — Can the business pay its short-term obligations?
- Debt-to-equity ratio — How much of the business is funded by debt vs. owners?
- Net asset value — Total Assets minus Total Liabilities = what owners actually own.
Lesson Summary
- The balance sheet is a point-in-time snapshot: Assets = Liabilities + Equity.
- Assets are classified as current or non-current; liabilities similarly.
- Key metrics derived: current ratio, debt-to-equity ratio, net asset value.
Balance Sheet Deep Dive: Assets, Liabilities, and Equity
The balance sheet is a snapshot — not a movie. It captures financial position at one moment, like a photograph. Understanding what belongs where is the foundation of financial analysis.
Current vs. Non-Current: The Key Distinction
| Category | Definition | Examples | Rule of Thumb |
|---|---|---|---|
| Current Assets | Converted to cash within 12 months | Cash, Accounts Receivable, Inventory, Prepaid Expenses | Listed in order of liquidity (cash first) |
| Non-Current Assets | Long-term, used over many years | Equipment, Buildings, Land, Intangibles, Goodwill | Shown net of accumulated depreciation |
| Current Liabilities | Due within 12 months | Accounts Payable, Accrued Expenses, Short-term Loans, Deferred Revenue | Pay with current assets |
| Non-Current Liabilities | Due beyond 12 months | Long-term bonds, Mortgage, Pension Obligations | Funded by long-term capital |
| Equity | Residual claim of owners | Common Stock, Retained Earnings, Additional Paid-In Capital | Always = Assets − Liabilities |
Full Balance Sheet Example: Meridian Software Inc. (Dec 31)
| ASSETS | $ | LIABILITIES & EQUITY | $ |
|---|---|---|---|
| Current Assets | Current Liabilities | ||
| Cash | 85,000 | Accounts Payable | 32,000 |
| Accounts Receivable | 48,000 | Accrued Wages | 8,500 |
| Inventory | 27,000 | Income Tax Payable | 6,000 |
| Prepaid Insurance | 4,000 | Short-term Bank Loan | 25,000 |
| Total Current Assets | 164,000 | Total Current Liabilities | 71,500 |
| Non-Current Assets | Non-Current Liabilities | ||
| Equipment | 120,000 | Long-term Loan | 80,000 |
| Less: Accum. Depreciation | (35,000) | ||
| Land | 50,000 | Total Non-Current Liabilities | 80,000 |
| Total Non-Current Assets | 135,000 | Equity | |
| Common Stock | 60,000 | ||
| Retained Earnings | 87,500 | ||
| Total Equity | 147,500 | ||
| TOTAL ASSETS | 299,000 | TOTAL L + E | 299,000 |
$299,000 = $299,000 ✓. Assets always equal Liabilities + Equity. If your balance sheet doesn’t balance, there’s an error — find it before presenting to investors or the bank.
Balance Sheet Practice Worksheet — Download, print, and complete to reinforce this lesson.
Multi-sheet workbook · pre-built formulas · plug in your own numbers · yours to keep.
Disclaimer. This lesson is educational. The worked example uses representative numbers and does not constitute personalized financial, tax, legal, or investment advice. Trading and investing involve risk including loss of principal. US tax rates change annually — verify against the current IRS publications and your specific state’s tax code. See our Financial Disclaimer for the full statement.
Keeping Cash Flowing matters because it’s a core skill every US bookkeeper and accountant relies on to keep the books accurate and decision-ready. This lesson covers the mechanics, a clear worked example, and the common mistakes that trip up beginners.
Apply the concepts of keeping cash flowing to a real US-market scenario, using the downloadable template attached.
Working Capital and Liquidity: Can Your Business Pay Its Bills?
A business can be profitable on paper yet still run out of cash and fail. Working capital and liquidity measure whether a business has enough short-term resources to meet its short-term obligations — arguably the most critical survival metric for any business.
What Is Working Capital?
Working Capital = Current Assets − Current Liabilities
Positive working capital means current assets exceed current liabilities — the business can cover its near-term obligations. Negative working capital signals potential cash flow problems.
Example:
Current Assets: $450,000 (Cash $100,000 + Receivables $200,000 + Inventory $150,000)
Current Liabilities: $200,000 (Payables $120,000 + Short-term loan $80,000)
Working Capital = $450,000 − $200,000 = $250,000 ✓ Healthy
Liquidity Ratios
Current Ratio = Current Assets ÷ Current Liabilities
A ratio above 1.0 means assets exceed obligations. A ratio of 2.0 is often cited as comfortable, though this varies by industry. Retailers with fast inventory turnover can operate safely at 1.2–1.5.
Quick Ratio (Acid-Test) = (Current Assets − Inventory) ÷ Current Liabilities
Inventory can be slow to convert to cash. The quick ratio removes inventory, giving a more conservative picture of immediate liquidity.
Cash Ratio = Cash and Cash Equivalents ÷ Current Liabilities
The most conservative measure — only counts actual cash. Useful for assessing worst-case scenarios.
The Cash Conversion Cycle
The cash conversion cycle (CCC) measures how long it takes for a business to convert inventory investment into cash receipts from customers:
CCC = Days Inventory Outstanding + Days Sales Outstanding − Days Payable Outstanding
A shorter CCC means cash is tied up for less time — better liquidity. Businesses like supermarkets have very short CCCs (they sell quickly and delay payments to suppliers); manufacturing businesses often have longer ones.
Managing Working Capital
- Collect receivables faster — Offer early-payment discounts; chase overdue invoices promptly.
- Manage inventory efficiently — Avoid over-stocking; use just-in-time ordering where possible.
- Negotiate supplier terms — Extending payment terms from 30 to 45 days improves your cash position without costing anything.
- Maintain a cash buffer — Having 1–3 months of operating expenses in reserve protects against unexpected downturns.
Lesson Summary
- Working Capital = Current Assets − Current Liabilities; positive is healthy.
- Current ratio, quick ratio, and cash ratio measure different levels of liquidity conservatism.
- The cash conversion cycle shows how efficiently a business converts investment into cash.
Working Capital: The Engine of Daily Operations
Working capital is the lifeblood of operations. A profitable business can still fail if it runs out of cash to pay suppliers and employees. Working capital measures whether you have enough short-term resources to meet short-term obligations.
Working Capital = Current Assets − Current Liabilities
A positive number means the business can fund its day-to-day operations. Negative working capital is a red flag — unless you’re a large retailer that collects cash before paying suppliers (like Walmart).
The Liquidity Ratio Family — Interpretation Guide
| Ratio | Formula | Ideal Range | What a Low Ratio Signals | What a High Ratio Signals |
|---|---|---|---|---|
| Current Ratio | Current Assets ÷ Current Liabilities | 1.5 – 3.0 | Short-term solvency risk | May be holding too much idle cash/inventory |
| Quick Ratio | (CA − Inventory) ÷ CL | 1.0 – 2.0 | Inventory may not convert fast enough | Strong without relying on selling inventory |
| Cash Ratio | Cash ÷ CL | 0.5 – 1.0 | Depends heavily on receivables | May be over-hoarding cash that should be invested |
Industry Comparison: Why Context Matters
| Industry | Typical Current Ratio | Why? |
|---|---|---|
| Grocery retail | 0.5 – 0.8 | Inventory moves fast; customers pay cash; suppliers give credit |
| Manufacturing | 1.5 – 2.5 | Needs more inventory buffer; production cycles are longer |
| Software / SaaS | 2.0 – 5.0 | Low inventory; high cash from subscriptions; fewer payables |
| Construction | 1.2 – 1.8 | Project-based; progress billing creates fluctuations |
A business can be profitable on paper (positive net income) and still become insolvent if it cannot convert assets to cash fast enough. This is why the cash flow statement matters as much as the income statement — always look at both.
Working Capital & Liquidity Practice Worksheet — Download, print, and complete to reinforce this lesson.
Multi-sheet workbook · pre-built formulas · plug in your own numbers · yours to keep.
Disclaimer. This lesson is educational. The worked example uses representative numbers and does not constitute personalized financial, tax, legal, or investment advice. Trading and investing involve risk including loss of principal. US tax rates change annually — verify against the current IRS publications and your specific state’s tax code. See our Financial Disclaimer for the full statement.
Measuring Profit and Loss matters because it’s a core skill every US bookkeeper and accountant relies on to keep the books accurate and decision-ready. This lesson covers the mechanics, a clear worked example, and the common mistakes that trip up beginners.
Apply the concepts of measuring profit and loss to a real US-market scenario, using the downloadable template attached.
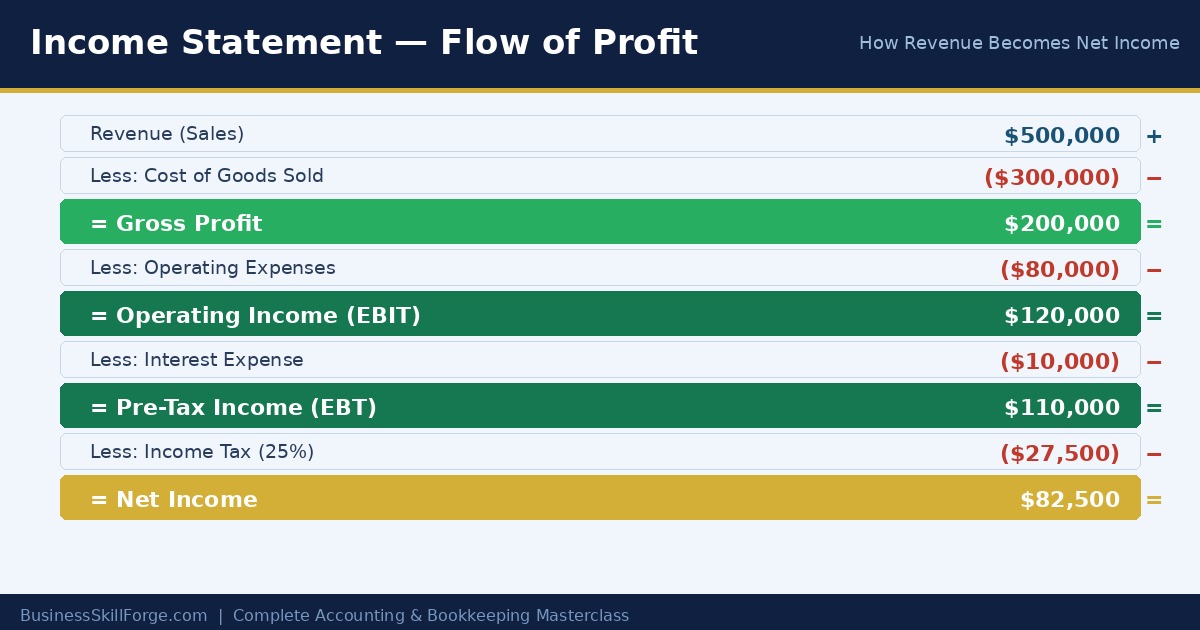
The Income Statement: Measuring Profit Over a Period
The income statement (also called the Profit and Loss Statement or P&L) reports a business’s financial performance over a specific time period — typically a month, quarter, or year. It answers one fundamental question: Did the business earn more than it spent?
Structure of the Income Statement
- Revenue (Sales / Turnover) — Total income from selling goods or services.
- Less: Cost of Goods Sold (COGS) — Direct costs of producing the goods/services sold.
- = Gross Profit — Revenue minus COGS. Measures the core business profitability before overheads.
- Less: Operating Expenses — Indirect costs: salaries, rent, marketing, depreciation, utilities.
- = Operating Profit (EBIT) — Earnings Before Interest and Tax. Measures profit from core operations.
- Less/Plus: Finance Costs / Income — Interest on borrowings; interest earned on investments.
- = Profit Before Tax (PBT)
- Less: Income Tax Expense
- = Net Profit (Net Income) — The “bottom line.” What remains for the owners.
Sample Income Statement
TechFlow Solutions — Income Statement for the Year Ended December 31, 2025
Revenue: $5,000,000
Less COGS: ($2,000,000)
Gross Profit: $3,000,000 (Gross Margin: 60%)
Less Operating Expenses: ($1,800,000)
Operating Profit (EBIT): $1,200,000
Less Interest Expense: ($200,000)
PBT: $1,000,000
Less Tax (25%): ($250,000)
Net Profit: $750,000
Key Profit Margins to Monitor
- Gross Margin = Gross Profit ÷ Revenue × 100. Higher is better — indicates how much is left after direct costs.
- Operating Margin = EBIT ÷ Revenue × 100. Measures operational efficiency.
- Net Profit Margin = Net Profit ÷ Revenue × 100. The ultimate profitability measure.
Single-Step vs. Multi-Step Income Statement
A single-step statement lists all revenues, then all expenses, and subtracts. Simple but less informative.
A multi-step statement (shown above) separates gross profit from operating profit from net profit. It gives far more analytical insight and is preferred for management and investor use.
EBITDA: A Popular Proxy for Cash Flow
EBITDA (Earnings Before Interest, Tax, Depreciation and Amortization) adds back non-cash charges to operating profit. It is widely used in business valuation and for comparing companies across different capital structures. However, it is not a substitute for actual cash flow analysis.
Lesson Summary
- Income statement: Revenue → Gross Profit → EBIT → PBT → Net Profit.
- Key margins: gross, operating, and net profit margin.
- Multi-step format provides more analytical depth than single-step.
Multi-Step vs. Single-Step Income Statement
There are two formats for the income statement:
- Single-step: All revenues together minus all expenses together = net income. Simple but lacks detail.
- Multi-step: Shows gross profit, operating income, and net income separately. Far more useful for analysis.
Most businesses, banks, and investors use the multi-step format. Here is a full multi-step income statement for Summit Outdoor Gear:
| Income Statement — Summit Outdoor Gear | Year Ended Dec 31 | Amount ($) |
|---|---|
| Revenue | |
| Net Sales Revenue | 480,000 |
| Cost of Goods Sold | |
| Beginning Inventory | 45,000 |
| + Purchases | 210,000 |
| − Ending Inventory | (38,000) |
| = Cost of Goods Sold | (217,000) |
| GROSS PROFIT | 263,000 |
| Operating Expenses | |
| Salaries & Wages | 85,000 |
| Rent | 24,000 |
| Depreciation | 12,000 |
| Marketing | 18,000 |
| Other Operating Expenses | 9,000 |
| Total Operating Expenses | (148,000) |
| OPERATING INCOME (EBIT) | 115,000 |
| Interest Expense | (8,000) |
| Income Before Tax (EBT) | 107,000 |
| Income Tax Expense (25%) | (26,750) |
| NET INCOME | $80,250 |
Key Profitability Ratios From the Income Statement
| Metric | Formula | Summit Result | What It Means |
|---|---|---|---|
| Gross Profit Margin | Gross Profit ÷ Revenue | $263,000 ÷ $480,000 = 54.8% | For every $1 of sales, $0.548 remains after production costs |
| Operating Margin | EBIT ÷ Revenue | $115,000 ÷ $480,000 = 24.0% | 24 cents of operating profit from each dollar sold |
| Net Profit Margin | Net Income ÷ Revenue | $80,250 ÷ $480,000 = 16.7% | After all costs including tax, 16.7 cents kept per dollar sold |
The income statement shows revenue when earned, not when cash arrives. A company can report $480,000 of revenue but have far less cash if clients haven’t paid yet. Always cross-reference the income statement with the cash flow statement.
Income Statement Practice Worksheet — Download, print, and complete to reinforce this lesson.
Multi-sheet workbook · pre-built formulas · plug in your own numbers · yours to keep.
Disclaimer. This lesson is educational. The worked example uses representative numbers and does not constitute personalized financial, tax, legal, or investment advice. Trading and investing involve risk including loss of principal. US tax rates change annually — verify against the current IRS publications and your specific state’s tax code. See our Financial Disclaimer for the full statement.
Where Cash Really Goes matters because it’s a core skill every US bookkeeper and accountant relies on to keep the books accurate and decision-ready. This lesson covers the mechanics, a clear worked example, and the common mistakes that trip up beginners.
Apply the concepts of where cash really goes to a real US-market scenario, using the downloadable template attached.
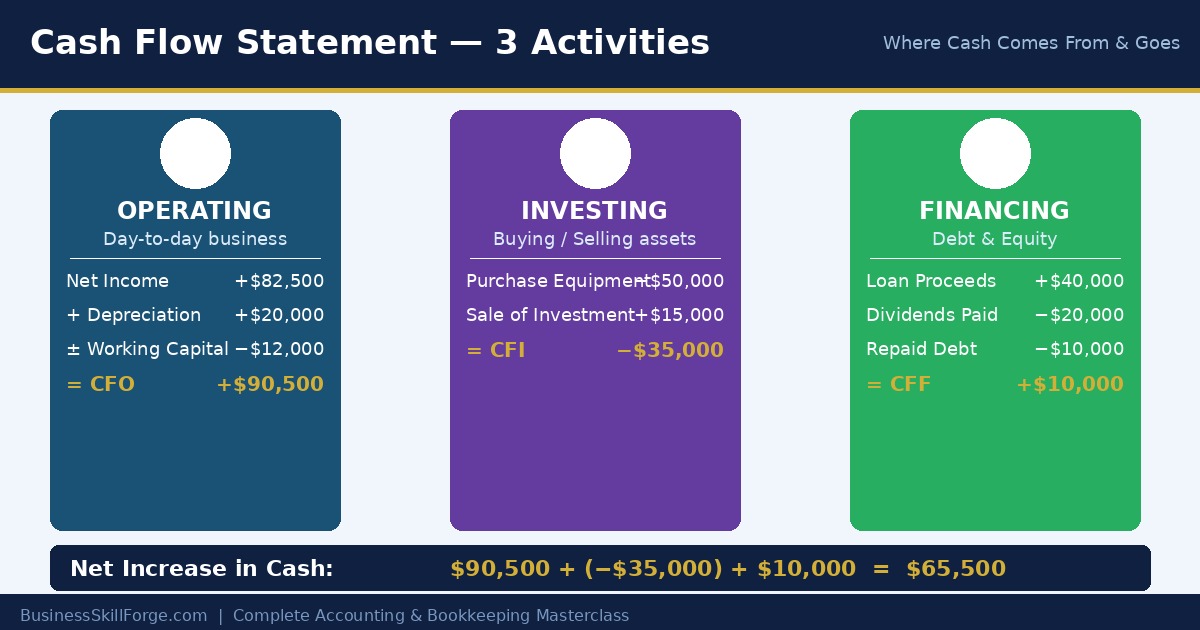
The Cash Flow Statement: Following the Actual Money
A profitable business can still go bankrupt — if it runs out of cash. The cash flow statement reconciles net income with actual cash movements, revealing whether the business generates real cash or merely accounting profits. It is arguably the statement least easy to manipulate and most trusted by experienced analysts.
Three Sections of the Cash Flow Statement
1. Operating Activities
Cash flows from the core business operations — collecting from customers, paying suppliers, paying employees. This is the most important section: consistently positive operating cash flow means the business model actually works.
Two methods:
- Direct method — Lists each type of cash receipt and payment explicitly (cash received from customers, cash paid to suppliers, etc.). More transparent but rarely used in practice.
- Indirect method — Starts with net income and adjusts for non-cash items (depreciation) and working capital changes. Most companies use this method.
2. Investing Activities
Cash flows from buying/selling long-term assets and investments. Negative investing cash flow often signals growth (buying new equipment or acquiring companies). Persistently positive investing cash flow can signal asset sales — potentially a warning sign.
3. Financing Activities
Cash flows from raising and repaying capital — bank loans, issuing shares, paying dividends, buying back shares.
A Simple Indirect-Method Cash Flow Statement
TechFlow Solutions — Cash Flow Statement (Year ended December 31, 2025)
Operating Activities:
Net Profit: $750,000
Add: Depreciation: $150,000
Less: Increase in Receivables: ($200,000)
Add: Increase in Payables: $80,000
Net Cash from Operations: $780,000Investing Activities:
Purchase of Equipment: ($500,000)
Net Cash from Investing: ($500,000)Financing Activities:
Proceeds from Bank Loan: $300,000
Dividend Paid: ($200,000)
Net Cash from Financing: $100,000Net Increase in Cash: $380,000
Opening Cash: $420,000
Closing Cash: $800,000 ← Must match Cash on Balance Sheet ✓
Key Signals Analysts Watch
- Free Cash Flow (FCF) = Operating Cash Flow − Capital Expenditures. What remains after maintaining and growing the asset base. Companies with strong FCF can pay dividends, repay debt, or make acquisitions.
- Cash vs. Profit mismatch — If net profit is high but operating cash flow is low, profits may be driven by aggressive accruals. Investigate receivables and revenue recognition.
- Capex intensity — High capital expenditure relative to revenue signals asset-heavy businesses with ongoing reinvestment needs (manufacturing, telecoms).
Lesson Summary
- Cash flow statement has three sections: operating, investing, and financing activities.
- The indirect method starts from net profit and adjusts for non-cash items and working capital changes.
- Free Cash Flow = Operating CF − Capex; closing cash must match the balance sheet.
Three Sections of the Cash Flow Statement — In Detail
| Section | What It Covers | Positive = Good? | Example Items |
|---|---|---|---|
| Operating Activities | Cash from core business operations | Yes — means operations generate cash | Collections from customers, payments to suppliers, wages paid, tax paid |
| Investing Activities | Cash from buying/selling long-term assets | Not necessarily — can be growth investment | Purchased equipment, sold a building, bought securities |
| Financing Activities | Cash from debt and equity transactions | Depends — issuing shares is good; excessive borrowing is risky | Borrowed from bank, repaid loan, issued stock, paid dividends |
Full Indirect Method Cash Flow — Summit Outdoor Gear
| Operating Activities | Amount ($) |
|---|---|
| Net Income | 80,250 |
| Add: Depreciation (non-cash) | 12,000 |
| Add: Decrease in Accounts Receivable | 5,000 |
| Less: Increase in Inventory | (7,000) |
| Add: Increase in Accounts Payable | 3,500 |
| Net Cash from Operating Activities | 93,750 |
| Investing Activities | |
| Purchased new shelving and POS system | (45,000) |
| Proceeds from sale of old equipment | 8,000 |
| Net Cash from Investing Activities | (37,000) |
| Financing Activities | |
| Repaid bank loan | (20,000) |
| Dividends paid | (15,000) |
| Net Cash from Financing Activities | (35,000) |
| Net Increase in Cash | 21,750 |
| Opening Cash Balance | 25,000 |
| Closing Cash Balance | $46,750 |
Summit earned $80,250 profit but generated $93,750 in operating cash — actually more than profit because depreciation is non-cash. This is very common. The reverse is also possible: profitable companies with negative operating cash flow are in danger of insolvency. Always read operating cash flow alongside net income.
Cash Flow Statement Practice Worksheet — Download, print, and complete to reinforce this lesson.
Multi-sheet workbook · pre-built formulas · plug in your own numbers · yours to keep.
Disclaimer. This lesson is educational. The worked example uses representative numbers and does not constitute personalized financial, tax, legal, or investment advice. Trading and investing involve risk including loss of principal. US tax rates change annually — verify against the current IRS publications and your specific state’s tax code. See our Financial Disclaimer for the full statement.
Keep exploring